Facts & Figures
- by mshelton - Sun, 02/23/2020 - 22:06
Facts & Figures
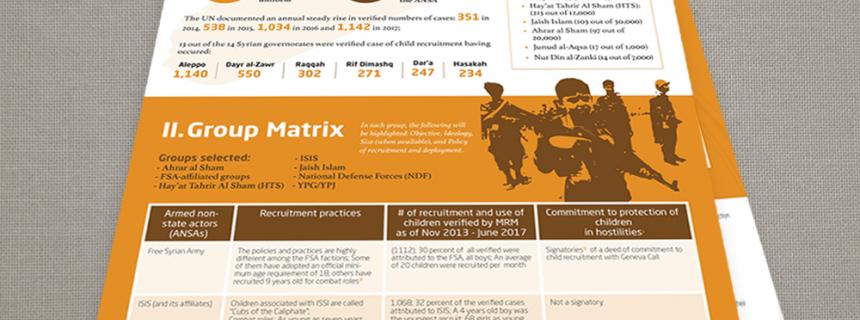
Infographics are used as a powerful tool to allow people to easily digest information through the use of visual data, charts, and statistics. With the proper use of color, proportion, and negative space, information can be transformed into memorable, attention-grabbing and even persuasive graphics.
U.S. Census Facts
- by mshelton - Sun, 07/28/2019 - 22:17
Census Bureau Infographics
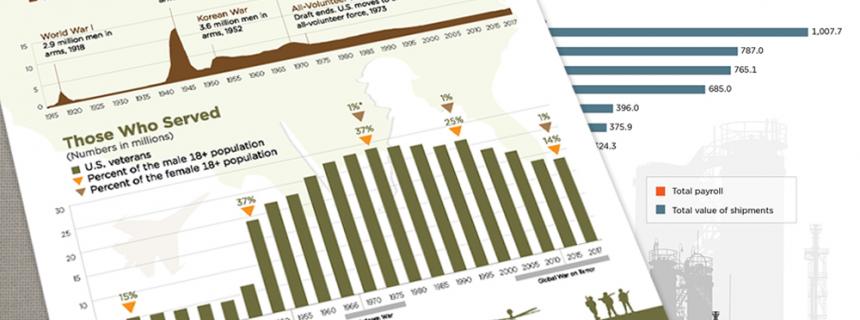
Infographics are a combination of graphic design, content and data. They are a visually compelling communication medium that allow federal agencies like the U.S. Census Bureau to present complex information that tells a story or transforms otherwise dry information into a captivating graphic.
Story Telling With Data
- by mshelton - Fri, 09/22/2017 - 23:54
Story Telling With Data
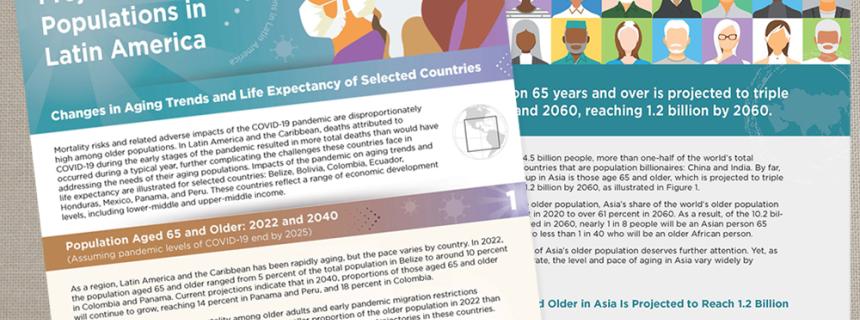
Effectively translate information into a visual context, such as a map or graph, to make data easier for the human brain to understand and pull insights from.
Software used for this project: Adobe Photoshop, Adobe Illustrator, Adobe InDesign, Microsoft Word


